IPL Winner Prediction using Machine Learning
Contributor - Diganta Dutta
Hello there, this article is about analyzing player and team performances in IPL(Indian Premier League) using Machine Learning to predict the winner.
Before we get started let tell you the Pre-requisites for this tutorial and the links which might come in handy. :)
Pre-requisite - Python 3.6, Jupyter Notebook
Libraries - Pandas, Numpy, Seaborn, Matplotlib, and Scikit-Learn
Presented in AI Code Gladiator Contest 2018 link here
There have been twelve seasons of the IPL tournament. The current IPL title holders are the Mumbai Indians, who won the 2019 season. (From Wikipedia).

It is necessary to model each and every player based on their performance. This will contribute to the overall team. For each player, IndvidualScore ∈ [0, 1] will be calculated which in turn will be used to calculate TeamScore . Then, comparing those score we can predict the winner, the winning percentage will be the ratio of the team score. The more the dataset set available to the training model the more the accurate prediction it provides.
Batsman score will be determined with 2 sectors -
1) Overall Performance
2) Recent Performance (last C0 matches)
The Parameters upon which a batsman score will be determined are Matches Played, Matches Win, Batting Innings, TotalRuns, Highest Score, Batting Average, Strike Rate, Ball Faced, Number of Centuries and Number of Fifties. The table is given below whichconsist of top 10 data CSk all the data.
Suppose all batsman( Pbatsman) playing in a Match (Mn)
for all Pbatsman ∈ Mn
x <= C1 * sqrt(Batting_Innings / Matches_Played);
y <= C2 * Num_Centuries + C3 * Num_Fifties
z <= C4 * x + C5 * Batting_Average + C6 * Strike_Rate
Career_Scorebat <= y * z
C0 <= Recent matches played by Pbatsman
Recent_Scorebat <= Career_Scorebat (Last C0 match)
Player_Scorebat <= C7 * Career_Scorebat + C8 * Recent_Scorebat
Normalized_Player_Scorebat <= Player_Scorebat / max ( Player_Scorebat )
end

Even though cricket is called a batsman’s game, one cannot undermine the importance of specialist bowlers in a team. A team usually comprises of a set of 4-5 specialist bowlers out of 11 players. A good bowling unit can impact a game by restricting the opponent team to a lower score and hence directly affects the outcome of the game. To model a bowler, we are examining his career performances to estimate his potential for the next match. The past performances of a bowler and his career records give us a good insight into his capabilities.
Parameters by with which we will model our players are Matches Played, Bowling Innings, Over Bowled, Runs Given, Wickets Taken, BBI, Five Wicket Hauls, Bowling Average and Bowling Economy. The table is given below whichconsist of top 10 data CSk all the data.

Suppose all bowler( Pbowler) playing in a Match (Mn)
for all Pbowler ∈ Mn
x <= C1 * sqrt(Bowling_Innings / Matches_Played);
y <= C2 * Five_Wickets_Hauls + C3 * Wicket_Taken
z <= C4 * Bowling_Average * Economy_Rate + C5 * Runs_Given
Career_Scorebowl <= ( x * y ) / z
C0 <= Recent matches played by Pbowler
Recent_Scorebowl <= Career_Scorebowl (Last C0 match)
Player_Scorebowl <= C6 * Career_Scorebowl + C7 * Recent_Scorebowl
Normalized_Player_Scorebowl <= Player_Scorebowl / max ( Player_Scorebowl )
end


Last but not the least match venue does have a little bit of contribution in predicting the outcome. Like some player has their preferences with their home ground that might boost the confidence in player. Thus, it does contribute to the outcome.
Parametres like NoOfMatchesPlayed, NoOfMatchesWon, NoOfMatchesOpponentPlayed, NoOfMatchedOpponentWon and WeatherForecast can be used to evaluate this model.
VenueScore will be used to denote this value. VenueScore ∈ [-1, 1] * c. Positive value favours our team while negative value favours the opponent team. As this value will contribute 2% to the overall outcome, so the value of c will be 0.020
Now, we have all the required information that we need during our calculation. Firstly, we will divide the total available set into two training set, matches from 2008 - 16 and test set, matches from 2017 - 19. The calculated values will be used to plot a logistic regression graph, according to which results will evaluated. The results will be dichotomous in nature i.e it will be either TRUR or it will be FALSE. True refers the winning of the team and False refers the opposite.


Result analysis provides us with the accuracy of our model. In average our model the result analysis score is found to be around 68.5%. I hope in the upcoming future the sccuracy will increase more with more training data set. Also, there are many factors that have been ignored in our models like match tie, D/L method, weather condition, player pressure, scoring analysis. This are the topic to be covered next time.
Before we get started let tell you the Pre-requisites for this tutorial and the links which might come in handy. :)
Pre-requisite - Python 3.6, Jupyter Notebook
Libraries - Pandas, Numpy, Seaborn, Matplotlib, and Scikit-Learn
Links-
Dataset link herePresented in AI Code Gladiator Contest 2018 link here
What is IPL?
Okay, let me tell you about a little bit about IPL first. It is a professional Twenty20 cricket league in India contested during March or April and May of every year by eight teams representing eight different cities in India. The league was founded by the Board of Control for Cricket in India (BCCI) in 2008. IPL has an exclusive window in ICC Future Tours Programme. The IPL is the most-attended cricket league in the world and in 2014 ranked sixth by average attendance among all sports leagues. In 2010, the IPL became the first sporting event in the world to be broadcast live on YouTube. The brand value of IPL in 2018 was US$6.3 billion, according to Duff & Phelps According to BCCI, the 2015 IPL season contributed ₹11.5 billion to the GDP of the Indian economy.There have been twelve seasons of the IPL tournament. The current IPL title holders are the Mumbai Indians, who won the 2019 season. (From Wikipedia).
 |
| IPL Teams |
Introduction -
Players are the key values for every team, based on their performance one can predict the outcome of the result. The strength and ability of the player is the key factor to determine. However, the outcome may still depend on factors like match venue, condition, and opponent team. Therefore, we will prepare our dynamic model considering all the factors that can affect the outcome. Modelling each player and their contribution to the team will be the correct strategy to formulate. I will classify the players using the kNN algorithm, it yields a more precise p.
Players have different roles in cricket like Batsman, Bowler, WicketKeeper, Fielder, All-Rounder. As a good audience, we already know the players and their role like we know that MS Dhoni is a Wicket -Keeper and V Kohli is a Batsman but a computer does not know anything about that. It is just numbers for them to calculate. We will use several parameters to classify the player among Batsman, Bowler, etc. Those parametres will be batting average, bowling average, strike rate and economy rate with kNN algorithm to classify each player with their roles. Once the classification is done we will evaluate each players performance and add it to the TeamScore. TeamScore is score index by which the outcome will be determined, the greater the teamscore the higher chances the team will win. Using the training set from 2008 - 2016, we will predict the outcome of 2017-2019. This yields upto 68.5% accuracy overall and that is quite good for a new programmer to achieve.
Players have different roles in cricket like Batsman, Bowler, WicketKeeper, Fielder, All-Rounder. As a good audience, we already know the players and their role like we know that MS Dhoni is a Wicket -Keeper and V Kohli is a Batsman but a computer does not know anything about that. It is just numbers for them to calculate. We will use several parameters to classify the player among Batsman, Bowler, etc. Those parametres will be batting average, bowling average, strike rate and economy rate with kNN algorithm to classify each player with their roles. Once the classification is done we will evaluate each players performance and add it to the TeamScore. TeamScore is score index by which the outcome will be determined, the greater the teamscore the higher chances the team will win. Using the training set from 2008 - 2016, we will predict the outcome of 2017-2019. This yields upto 68.5% accuracy overall and that is quite good for a new programmer to achieve.
Player Classification -
First, we will classify the players based on their performance and determine their profile i.e, batsman, bowler or all-rounder. After calculating their profile it will be easy to determine the total batScore and bowlScore.
To classify the player we need details of batting average, bowling average, strike rate and economy rate of any given particular team. Let take CSK (Chennai Super King) as an example.
 |
| Chennai Super King(CSK) team-up 2019 |
There are total 25 player in the team but we will be evaluating only 15 players those are most likely to play based on previous play order. We will prepare our list with the information like batting average, bowling average, strike rate and economy rate.
 |
| CSK Players performance details. |
Let's plot the details using Python Seaborn ain Jupyter Notebook.


After plotting the graph we can easily see the difference, a line which clearly seperates the player among batsman and bowler. Any other player whose co-ordinate falls on the Bowler area will be considered as Bowler,, similar to other fields. This process of classification is achieved through supervised knn (K Nearest Neighbour) algorithm in which one's position is determine based on their nearest neighbour position.
Player Modelling -
It is necessary to model each and every player based on their performance. This will contribute to the overall team. For each player, IndvidualScore ∈ [0, 1] will be calculated which in turn will be used to calculate TeamScore . Then, comparing those score we can predict the winner, the winning percentage will be the ratio of the team score. The more the dataset set available to the training model the more the accurate prediction it provides.
Batsman Modelling -
In a match, almost every other player has their own importance but somehow it has been found that a batsman has more impact on winning the game rather than a bowler. So, the batting ability of a player has a significant contribution in shaping the outcome of a match. A team usually comprises of a set of 6-7 specialist batsmen out of 11 players. The batsmen form the backbone of a team, helping it in posting a high score or chasing down a competitive total.
Batsman score will be determined with 2 sectors -
1) Overall Performance
2) Recent Performance (last C0 matches)
The Parameters upon which a batsman score will be determined are Matches Played, Matches Win, Batting Innings, TotalRuns, Highest Score, Batting Average, Strike Rate, Ball Faced, Number of Centuries and Number of Fifties. The table is given below whichconsist of top 10 data CSk all the data.
 |
| Top 10 Batsman data of CSK |
Algorithm -
Suppose all batsman( Pbatsman) playing in a Match (Mn)
for all Pbatsman ∈ Mn
x <= C1 * sqrt(Batting_Innings / Matches_Played);
y <= C2 * Num_Centuries + C3 * Num_Fifties
z <= C4 * x + C5 * Batting_Average + C6 * Strike_Rate
Career_Scorebat <= y * z
C0 <= Recent matches played by Pbatsman
Recent_Scorebat <= Career_Scorebat (Last C0 match)
Player_Scorebat <= C7 * Career_Scorebat + C8 * Recent_Scorebat
Normalized_Player_Scorebat <= Player_Scorebat / max ( Player_Scorebat )
end
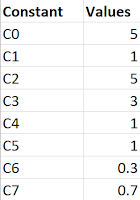
Experiments (Linear Regression ) -
A series of consecutive matches has been deliberately chosen to study the impact of a batsman on his upcoming performances. The estimated scores of the players are compared against their actual performances. After exhaustive experimentation, the final weights of the constants are chosen to a precise value. Given below are the data of the constants.

Modelling Bowler -
Even though cricket is called a batsman’s game, one cannot undermine the importance of specialist bowlers in a team. A team usually comprises of a set of 4-5 specialist bowlers out of 11 players. A good bowling unit can impact a game by restricting the opponent team to a lower score and hence directly affects the outcome of the game. To model a bowler, we are examining his career performances to estimate his potential for the next match. The past performances of a bowler and his career records give us a good insight into his capabilities.
Parameters by with which we will model our players are Matches Played, Bowling Innings, Over Bowled, Runs Given, Wickets Taken, BBI, Five Wicket Hauls, Bowling Average and Bowling Economy. The table is given below whichconsist of top 10 data CSk all the data.

Algorithm -
for all Pbowler ∈ Mn
x <= C1 * sqrt(Bowling_Innings / Matches_Played);
y <= C2 * Five_Wickets_Hauls + C3 * Wicket_Taken
z <= C4 * Bowling_Average * Economy_Rate + C5 * Runs_Given
Career_Scorebowl <= ( x * y ) / z
C0 <= Recent matches played by Pbowler
Recent_Scorebowl <= Career_Scorebowl (Last C0 match)
Player_Scorebowl <= C6 * Career_Scorebowl + C7 * Recent_Scorebowl
Normalized_Player_Scorebowl <= Player_Scorebowl / max ( Player_Scorebowl )
end
Experiments -
After experimenting with a series and fitting them in a Linear Regression model we can find out the constant values (approximately). .

Team Modelling -
Team modelling will determine the total strength of the entire team. This combines both the power of batsman and bowler and had the ultimate effect to determine the outcome of the results.
TotalTeamScore = TotalBowlerScore + TotalBatsmanScore
Opponent Team Modelling -
Opponent Batsman Modelling -
Opponent batsman model will follow the same algorithm that we used to model our team.
Opponent Bowler Modelling -
Follows the same model as our team bowler model.
Opponent Team Modelling -
Same as our team model.
Relative Team Modelling w.r.t Our Team -
Now, we will try to model the relative opponent team model with respect to our team i.e the performance of our team when played against a specific team like KKR or any other team. This is important to analyze how a team performs against any specific team and to analyze the record. It might happen sometime that a team is playing well overall in a Season but performing badly against any particular team. Then no matter whatever the overall team score of the team is, the winning percentage will decrease.
RelativeTeamScore will be used to denote this value. RelativeTeamScore ∈ [-1, 1] * c. If the value is positive that means our team has more chance to win but if the value is negative then the opponent has more likely to win. As this value will contribute 20% to the overall outcome, so the value of c will be 0.200 (exactness not verified though).
To compute the opponent team model we will use parameters like Match, TossWinner, TossDecision, WonByWicket, WonByRuns, TotalWicketFallen, TotalRunScored and Result.
To compute the opponent team model we will use parameters like Match, TossWinner, TossDecision, WonByWicket, WonByRuns, TotalWicketFallen, TotalRunScored and Result.

Venue Modelling -
Last but not the least match venue does have a little bit of contribution in predicting the outcome. Like some player has their preferences with their home ground that might boost the confidence in player. Thus, it does contribute to the outcome.
Parametres like NoOfMatchesPlayed, NoOfMatchesWon, NoOfMatchesOpponentPlayed, NoOfMatchedOpponentWon and WeatherForecast can be used to evaluate this model.
VenueScore will be used to denote this value. VenueScore ∈ [-1, 1] * c. Positive value favours our team while negative value favours the opponent team. As this value will contribute 2% to the overall outcome, so the value of c will be 0.020
Prediction -
Now, we have all the required information that we need during our calculation. Firstly, we will divide the total available set into two training set, matches from 2008 - 16 and test set, matches from 2017 - 19. The calculated values will be used to plot a logistic regression graph, according to which results will evaluated. The results will be dichotomous in nature i.e it will be either TRUR or it will be FALSE. True refers the winning of the team and False refers the opposite.

Result Analysis -
